Embodied AI Benchmark Atlas
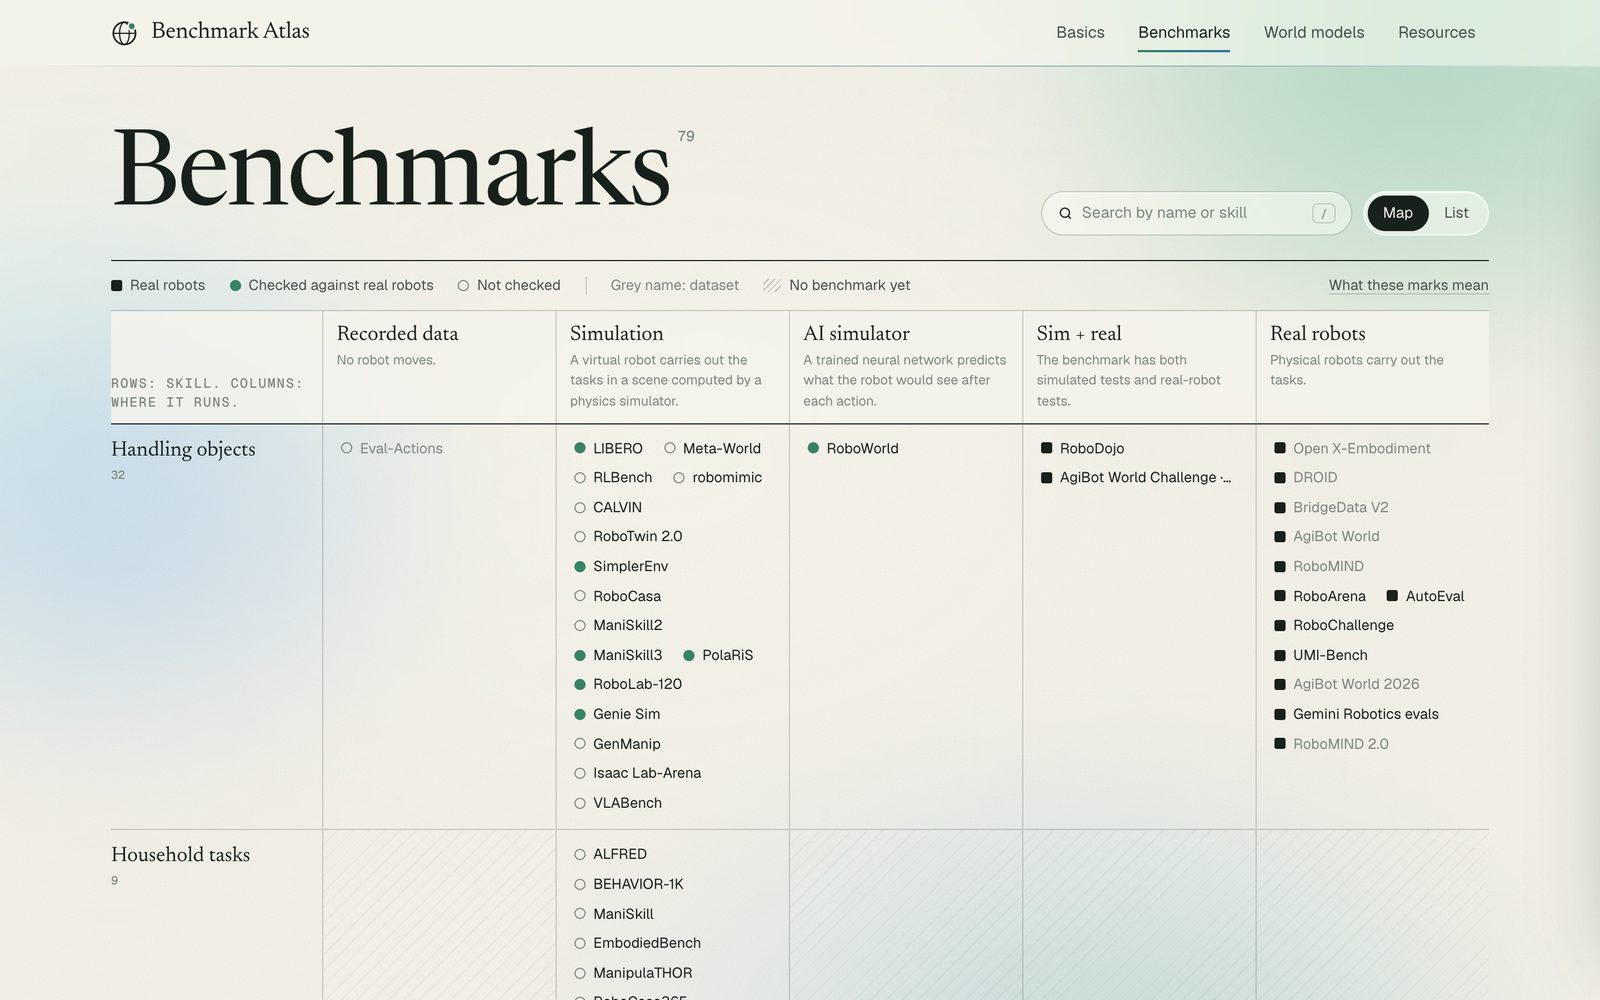
The Embodied AI Benchmark Atlas is a public reference site on how AI systems that control robots are tested. It covers 79 benchmarks and 70 world-model systems for readers who are new to the field.
- Role
- Research, product and design
- With
- VLGE
- Timeline
- 2026
- Links
- Open the Atlas ↗
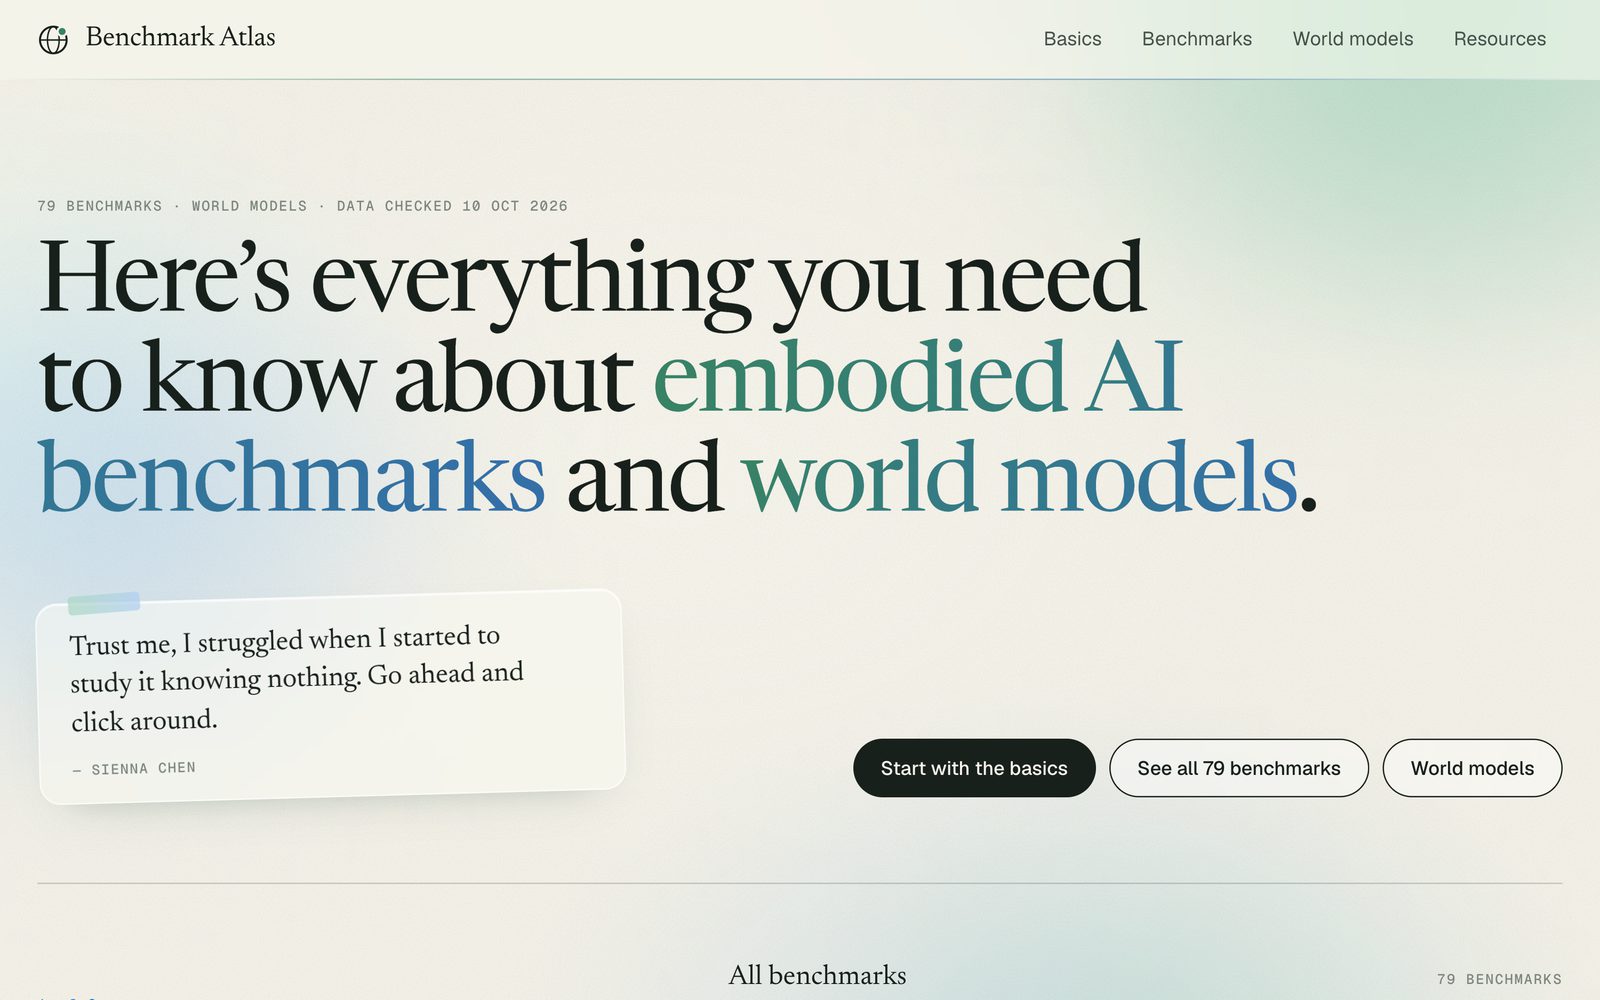
New embodied AI benchmarks appear every month, and most summaries do not show how well each claim is supported.
Embodied AI covers models that act in the physical world, such as robot arms that pick up objects. Labs measure these models with benchmarks, which are standard tests with published scores. Product managers, investors and students who are new to the field have no single place to check what each benchmark tests and whether its results hold on real robots.
I first mapped 32 benchmarks for VLGE in a research project. A table on a portfolio page is out of date within months, so I turned the research into a public site that stays current.
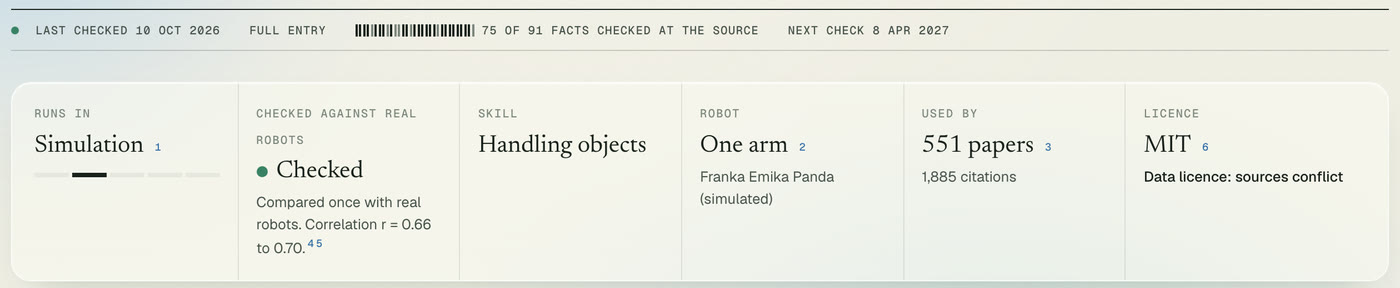
Each entry shows the evidence behind every fact it states.
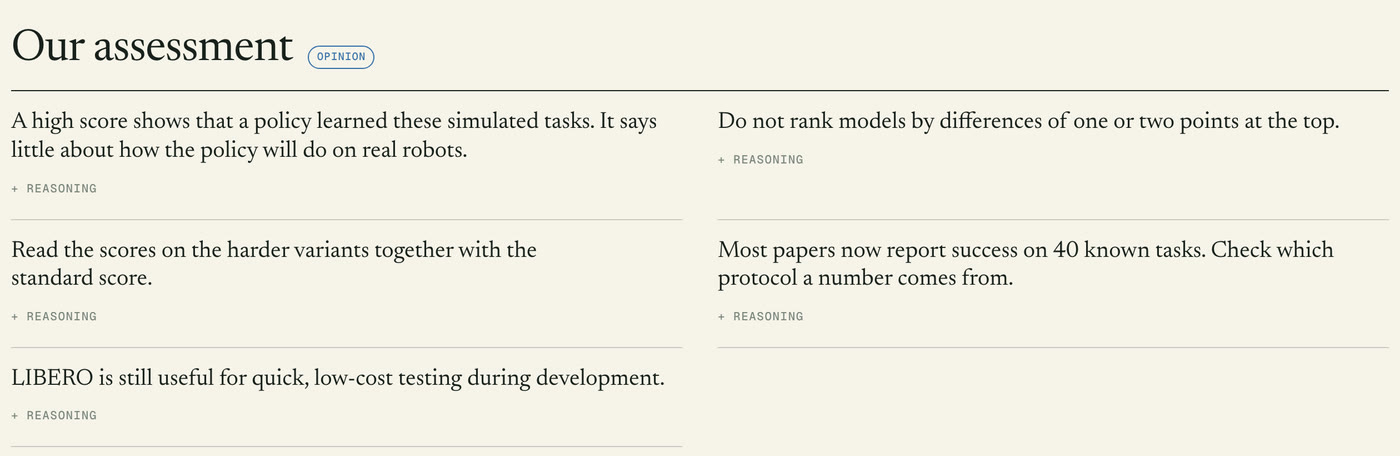
Every value carries a label: checked at the source, inferred, secondary or unknown, with the source number beside it. The site’s own assessment is kept separate and marked as opinion. Where sources disagree, both views are shown, and each entry records when it was last checked and when the next check is due.

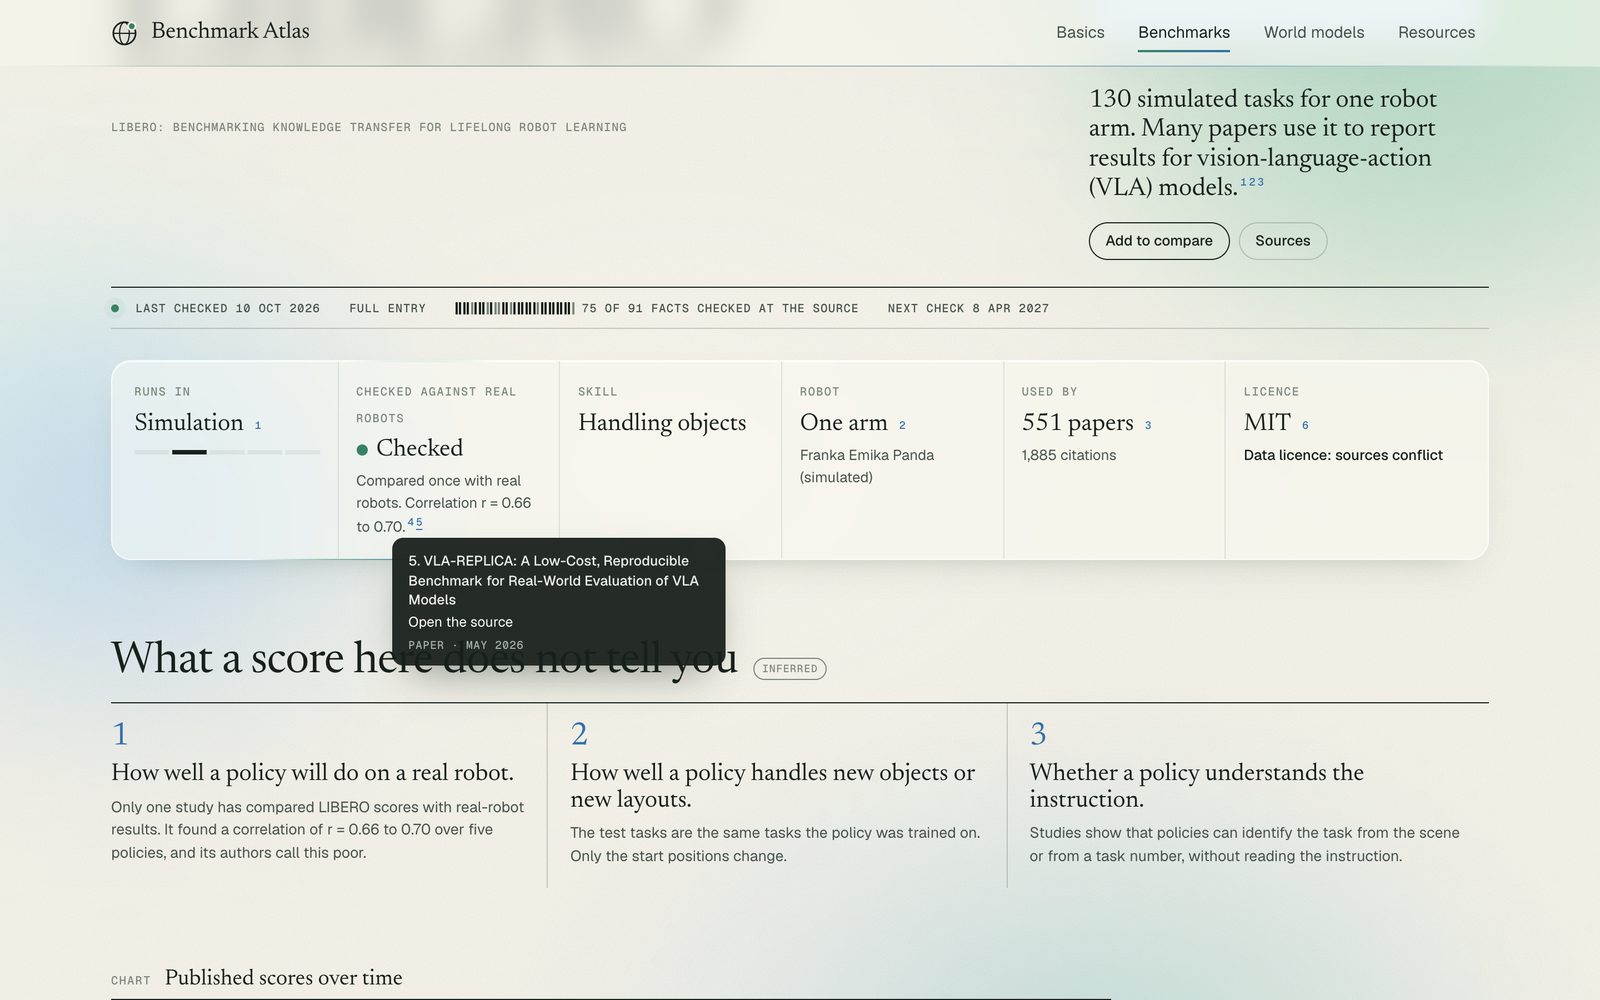

Only primary sources count as evidence, and every entry is checked again every 180 days.
Primary sources are the paper, the official site, the code or data, and the official leaderboard. News and other surveys are used only to find them. A weekly scan lists new papers and changed sources, and I review the list before the site changes. On the home page, the benchmarks appear as squares that regroup by where each test runs and whether it was checked against real robots.