VLGE
VLGE is a spatial and human intelligence platform that captures, generates, and scales real-world environments and human behavior to train, evaluate, and deploy intelligent agents. I redesigned and built its website, vlge.com, and made its motion graphics video and pitch deck.
- Role
- Design engineer: strategy, design, front end and motion
- Client
- VLGE
- Timeline
- September – October 2026
- Built with
- Claude Code, HTML, CSS, JavaScript, WebGL
- Links
- vlge.com ↗
The previous site had strong content, but its structure and copy hid what VLGE actually holds.
VLGE sells to teams building world models, robotics and agentic AI, and to enterprises in retail and real estate. Its buyers are technical and read the website before a first call.
Structure
Every section had the same label, heading, paragraph and card grid, so the Labs page ran to 16,800 pixels with no resting point, and the interactive instruments built on real data were lost in it.
Copy
The copy leaned on AI-style slogans such as “Real Spaces, Real People, Real Behaviour.”, three repetitions and no fact. I removed that line and kept the approved claims.
I reduced what every stakeholder said into one record of what VLGE actually holds.
Sources
Founder calls and replies, a technical workshop, a product-architecture session, earlier decks and an outside review, each kept as a dated source.
An asset register
Every claim the site or deck could make traces to one of those sources and is marked full, thin, absent, contradicted or open. Where sources disagreed, the question went to the founder.
One name per thing
I counted each word across the transcripts and documents and kept the most-used one. “Agent” appeared 109 times and “room” never, so the site, video and deck say “agent” and “world”.
Decisions left to the owners
Changes to public claims, such as naming partners as clients, were listed for the founder to decide.
Each page became numbered steps beside a contents rail.
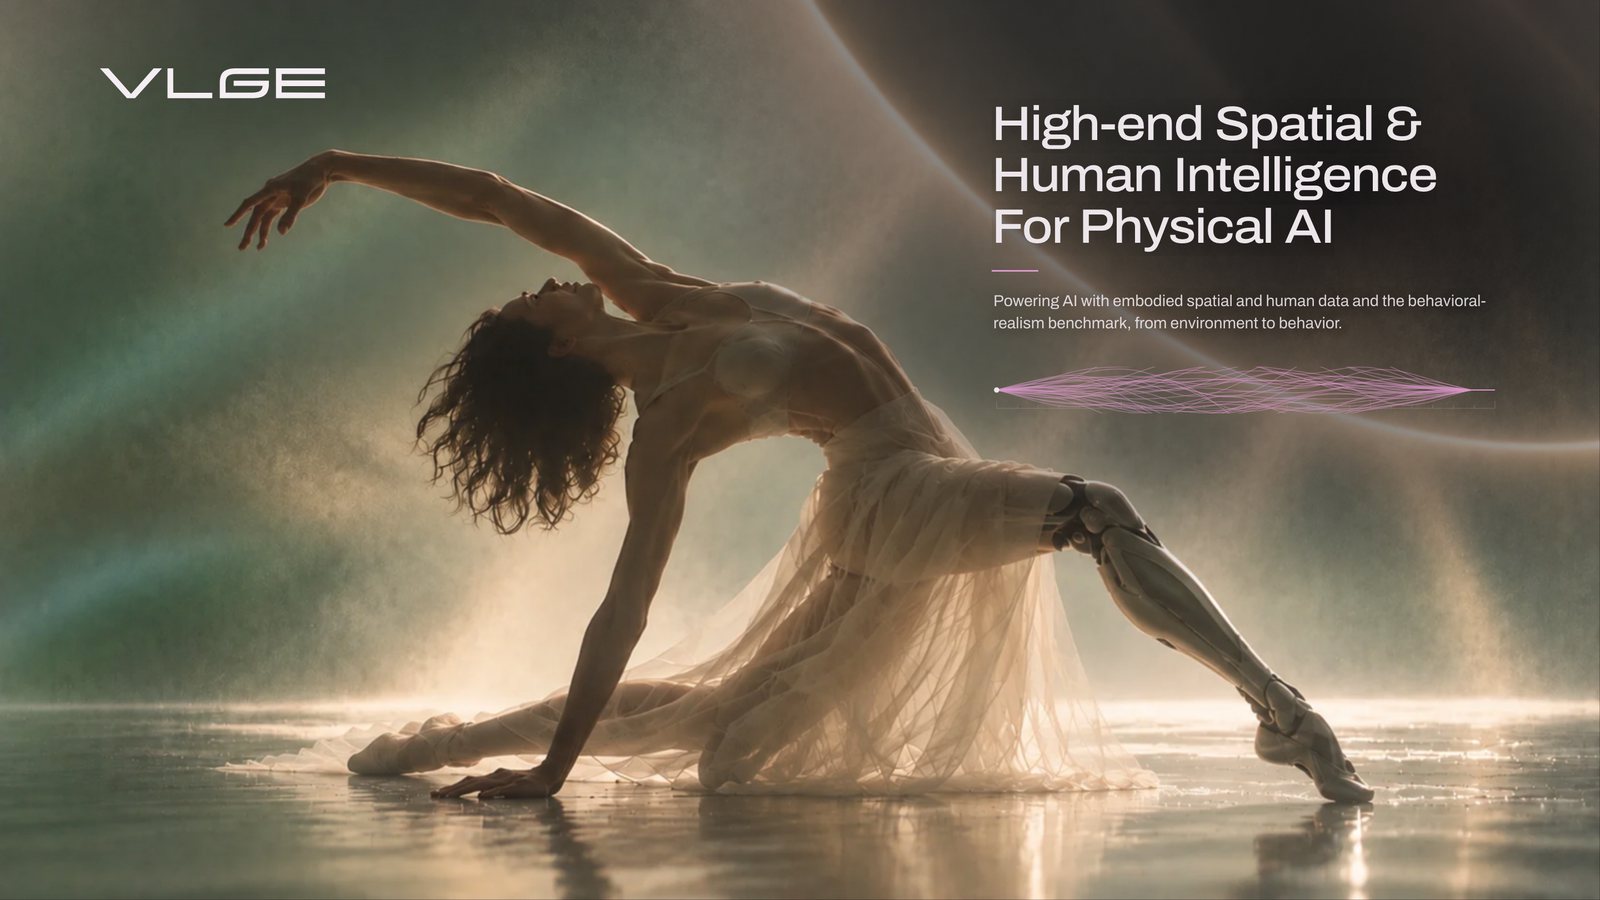
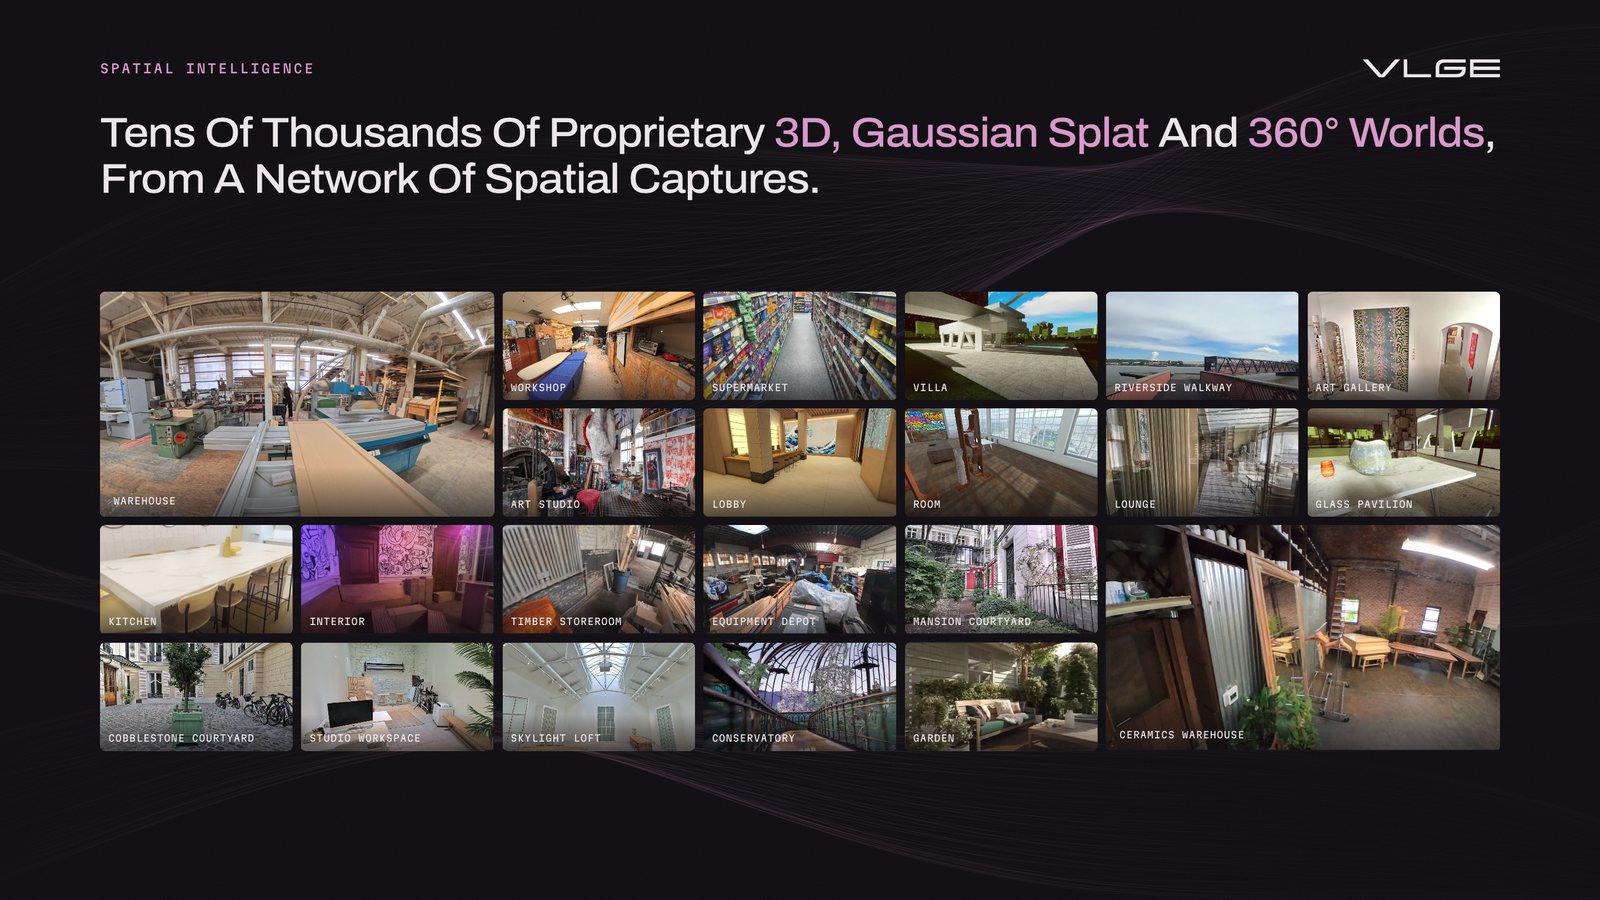
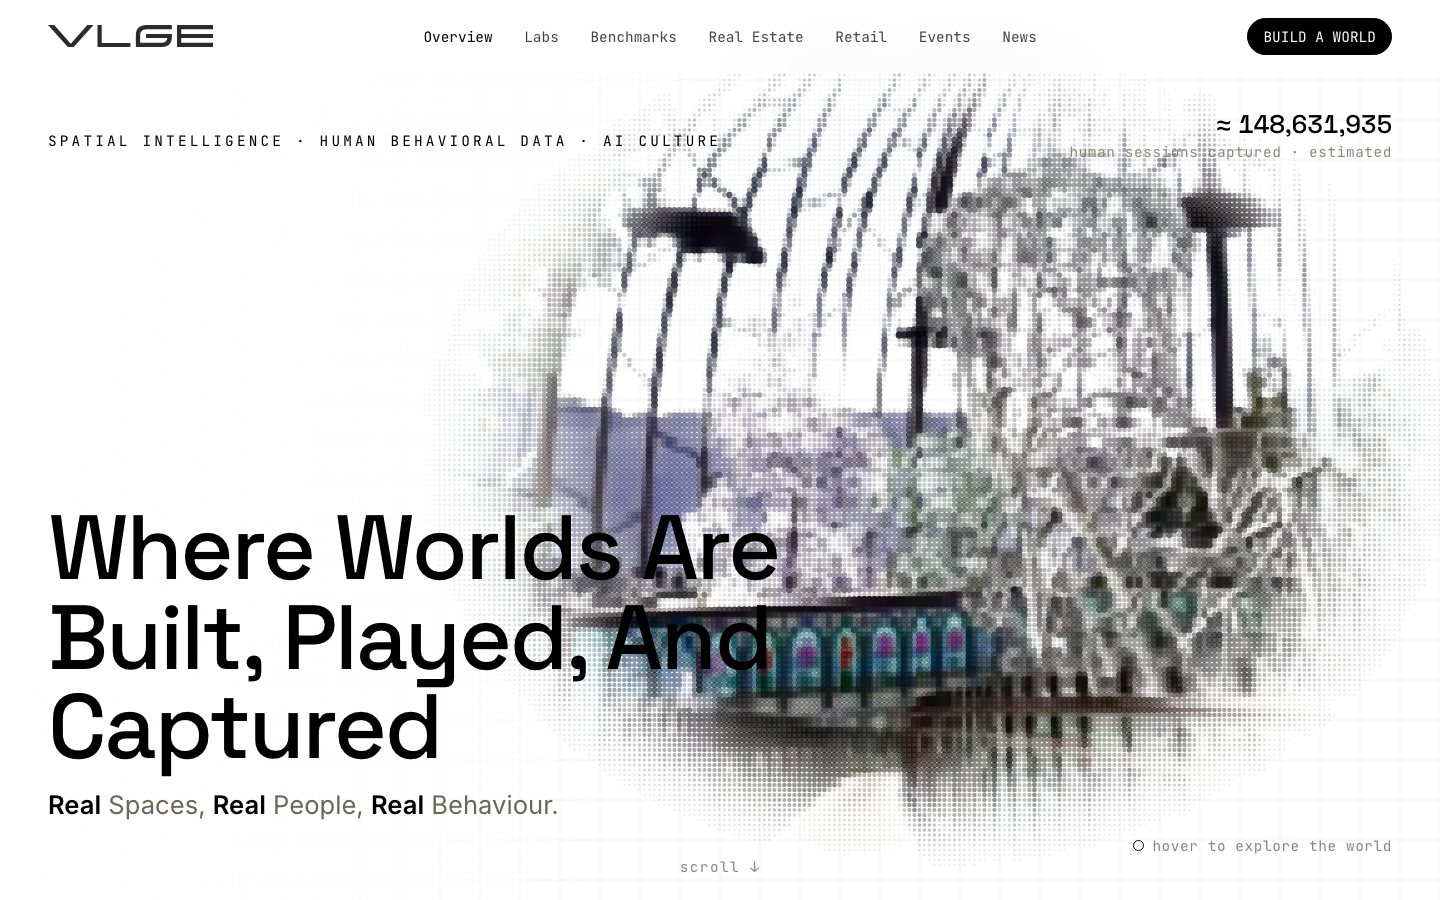
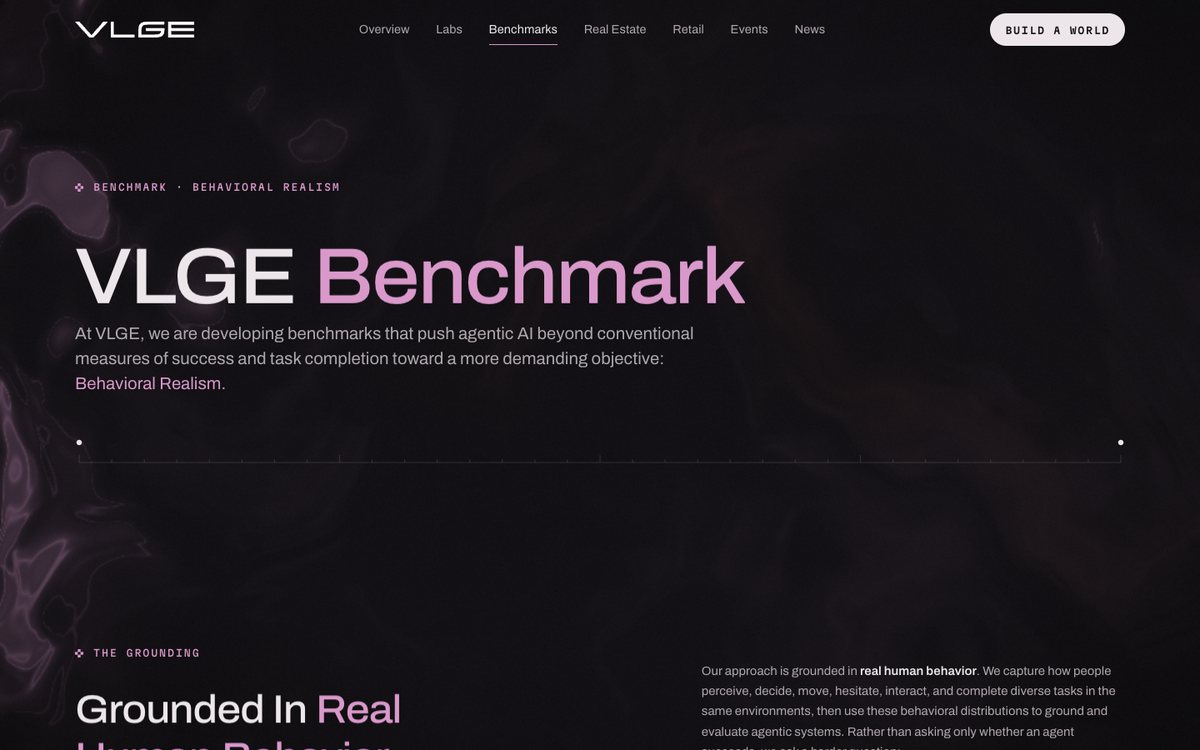
The home page opens with the deck’s cover line and a wall of captured worlds, then the summary figure and the steps. On Labs, the live demonstrations moved forward, a landscape figure places VLGE against simulation, generated video and first-person video, and repeated sections were removed.
Each figure visualises one part of the data and animates once, when the reader reaches it.
Figures
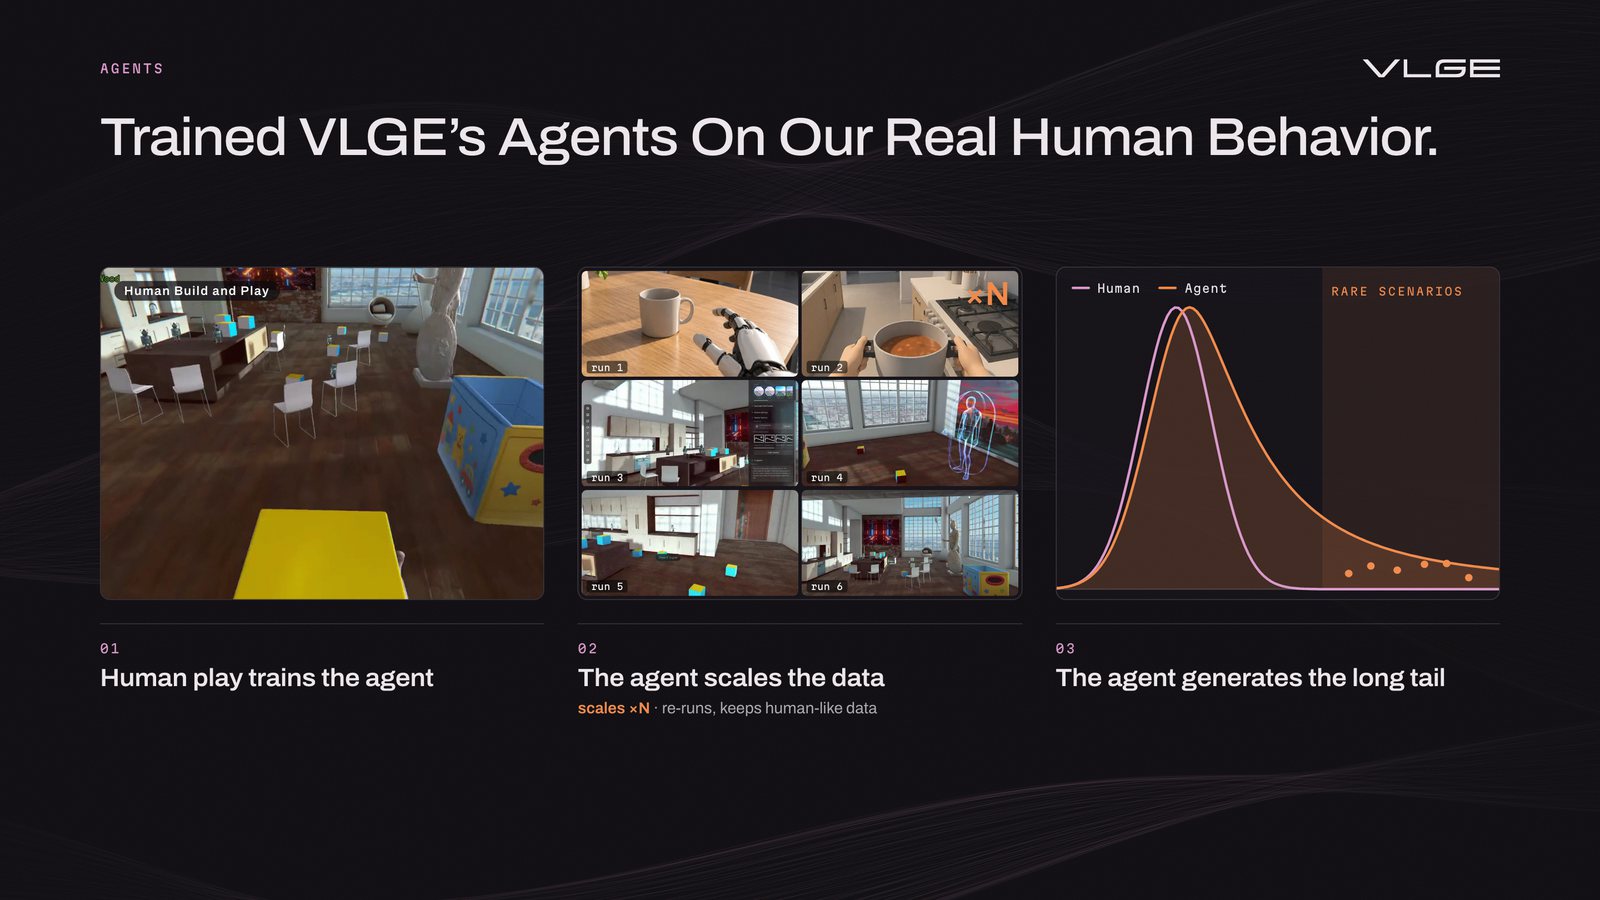
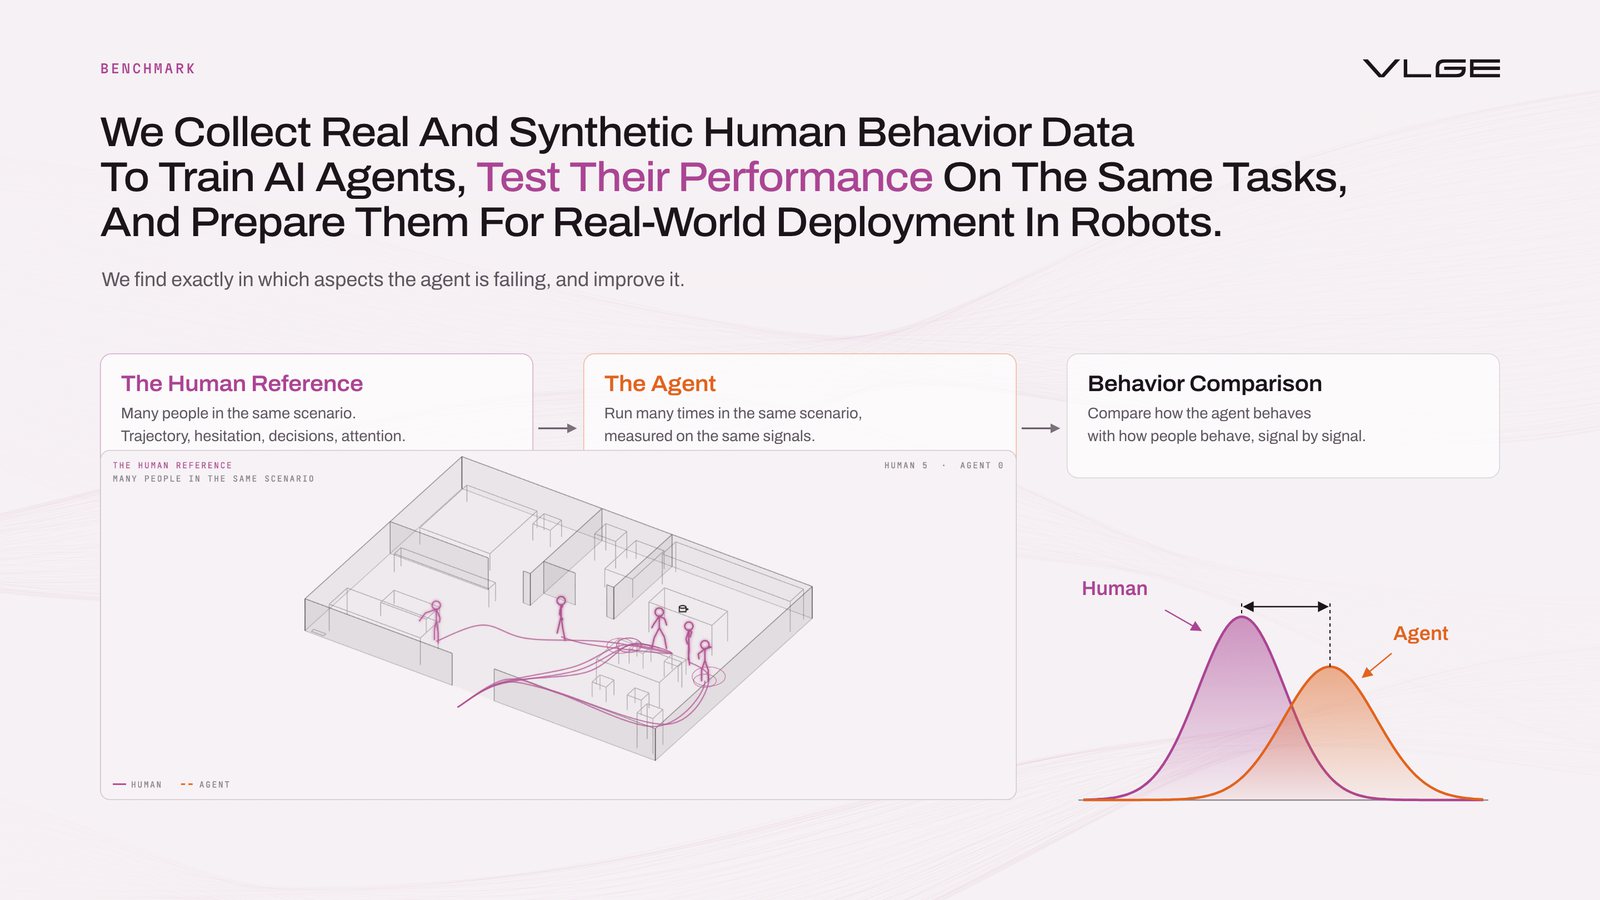
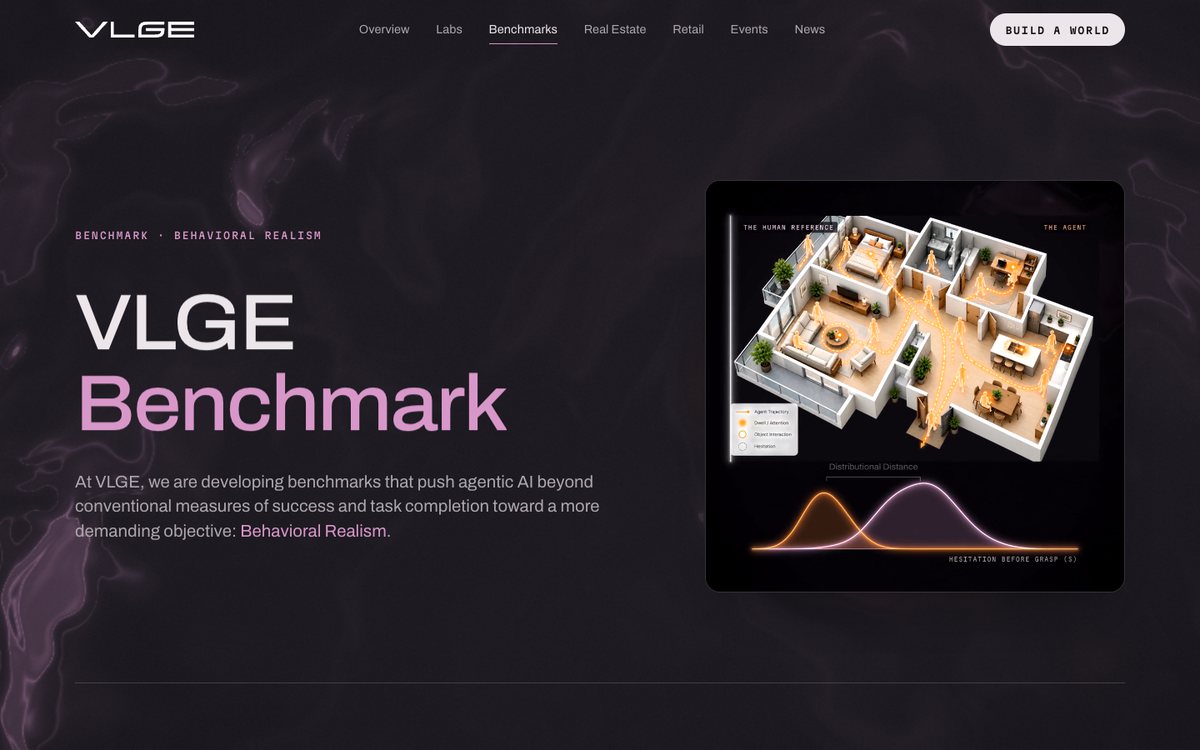
Numbers count up while their unit squares fill, the agent figure grows a long tail, the engine turns one demonstration into many runs, and the benchmark draws human and agent on the same apartment. Text does not animate.
Live instruments
The site has 18 interactive instruments on VLGE’s own data. I patched seven of their files so each takes its colours from the section around it.
I built the whole site myself with Claude Code.
A build script assembles each page from the live HTML and adds the new CSS and JavaScript. Every build checks all content against the live site, and every page is reviewed at seven screen sizes, from a 390-pixel phone to a 1920-pixel display.
The lilac and the thread lines come from VLGE’s earlier events, and the team asked me to keep them.
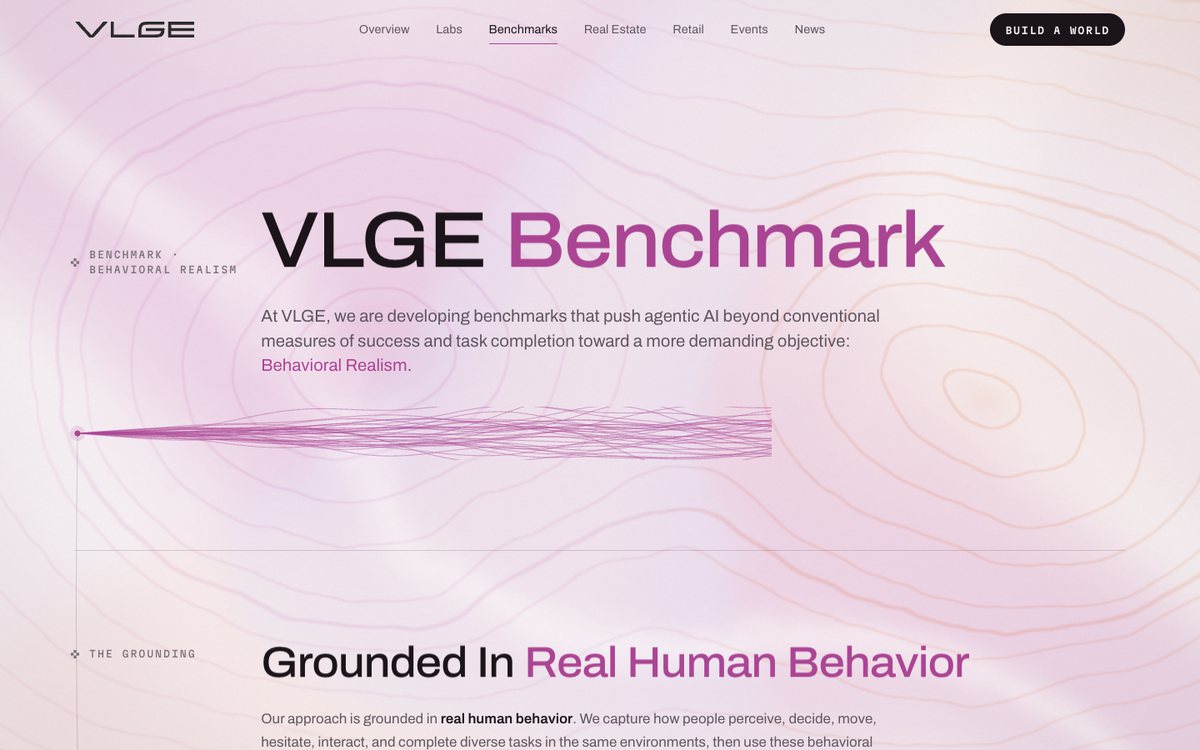
The thread lines stand for data flowing, and on the site they draw many runs stacking into a distribution. Lilac means people, orange means agents and bone means the world. I proposed three directions and merged the team’s feedback into the final site.
I produced VLGE’s 25-second marketing video in the website’s line style.
The video follows the company’s argument: data for physical AI forces a tradeoff, the physical world cannot be re-run, and VLGE captures, evaluates and trains on human behaviour. It comes in 15, 20 and 25 seconds, in 16:9 and 4:5, made in CodeCut, the video editor I built while working on these motion graphics.
The pitch deck tells the same story from the same register.
Nine pages, from the captured worlds to the benchmark, built as code and exported to PDF and PowerPoint with automated layout checks.